Trackferty is a computational platform developed to support the determination of mineral fertility in bedrock, based on the quantification of mineral concentration in sediment samples. The tool enables the modeling of mineral distribution across different grain-size classes, as well as the optimization of mineral recovery during separation procedures aimed at analysis. In addition, it incorporates grain-size analysis routines, which are considered essential for the characterization and classification of sedimentary environments. The platform was conceived on the basis of the method described by Malusà, Resentini, and Garzanti in Hydraulic sorting and mineral fertility bias in detrital geochronology (Gondwana Research, vol. 31, 2016, pp. 1–19)
MEASUREMENT OF MINERAL FERTILITY
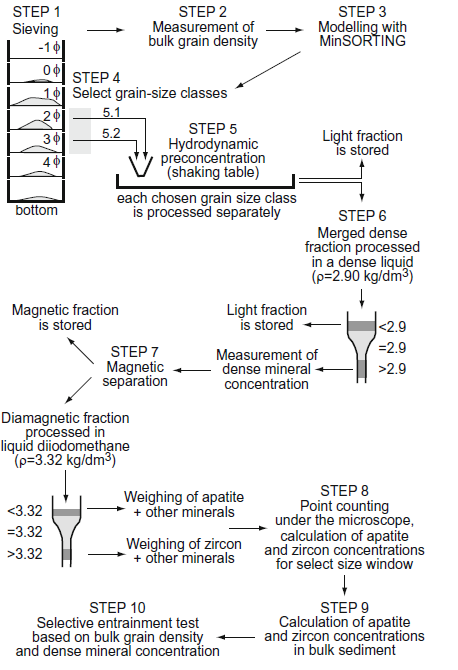
Workflow for determining mineral fertility of bedrock through analysis of mineral concentrations in sediments
CALG
Sieving (Step 1)
The sample is divided into different grain-size classes using sieves (1φ intervals). This allows the determination of the mean grain size (Dm) and sorting values (grain-size distribution).
CALM
STEP 3: Modelling with CALM
CALM the sorting of minerals based on grain-size and density data. It helps to predict the best fractions for separating heavy minerals like apatite and zircon.
Processing Flow
STEP 1
Sieving
The sediment is passed through a stack of sieves with different mesh sizes to separate the grains into specific grain-size classes. This helps to isolate particles by size for further analysis.
STEP 2
Measurement of bulk grain density
The overall density of the sample is measured. This is important for estimating how much of the sample is composed of heavy versus light minerals.
STEP 3
Modelling with MinSORTING
MinSORTING is a tool used to model the sorting of minerals based on grain-size and density data. It helps to predict the best fractions for separating heavy minerals like apatite and zircon.
STEP 4:
Select grain-size classes
Based on previous measurements and modeling, the most appropriate grain-size ranges are selected. Only the chosen size fractions will be processed further.
STEP 5:
Hydrodynamic preconcentration
A shaking table is used to separate particles based on density. Heavier particles move differently from lighter ones, allowing a physical separation into light and dense fractions.
STEP 6:
Measurement of dense mineral concentration
The dense fraction is placed in a liquid with known density (2.90 kg/dm³) to separate it further
STEP 7:
Magnetic separation
The dense fraction is subjected to a magnetic field to separate magnetic from non-magnetic (diamagnetic) minerals. Apatite and zircon are typically non-magnetic.
STEP 8:
Point counting under the microscope
Under a microscope, the minerals are counted grain-by-grain to determine the percentage of apatite and zircon in the selected fraction.
STEP 9:
Calculation of apatite and zircon concentrations in bulk sediment
Using the microscope data and earlier density/grain-size measurements, the total concentration of apatite and zircon in the original sediment is calculated.
STEP 10:
Selective entrainment test
This final test validates whether the chosen size and density fractions truly concentrate apatite and zircon efficiently, confirming the effectiveness of the separation workflow.
The TRACKs Group researches Geo-Thermochronology using U-Pb, Fission Track, and Raman dating methods on Apatite, Zircon, and Monazite. Our research is carried out in collaboration with universities, other research groups, and oil, gas, and mineral prospecting companies worldwide.
Our lab is open to new scientific and technological partnerships. For more information, please contact Prof. Dr. Airton Natanael Coelho Dias, the group coordinator, via email at diasanc@ufscar.br.